Visualise data from your device
In this section, we will explain how to create widgets for data visualisation and how to set up your device’s dashboard on Pybytes.
We’re assuming that you have already connected your device to Pybytes. In case you haven’t, check how to add your device here. After you’re done with that, you can proceed to the next example.
Step 1: Setup a Pymakr Project
-
Create a project in Pymakr called
Pybytes_signals, and add the following code tomain.py. This python application will send data every 5 seconds to Pybytes.# Import what is necessary to create a thread import time import math # Send data continuously to Pybytes while True: for i in range(0,20): pybytes.send_signal(1, math.sin(i/10*math.pi)) print('sent signal {}'.format(i)) time.sleep(10) -
Press Upload button to upload the code into your device.
Note that if you have a Pytrack or Pysense expansion board, you could also sent sensor data instead!
Step 2: Add a signal from your device
-
Go to the Pybytes device page select your device.
-
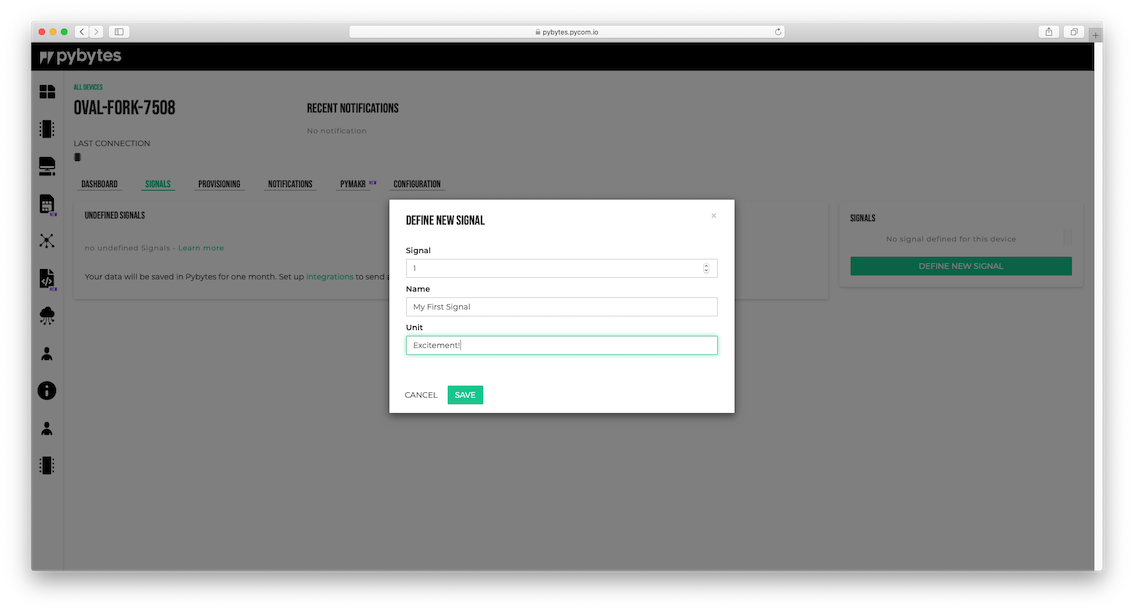
Then go to
Signalstab and click on define new signal
Step 3: Add a widget for the signal
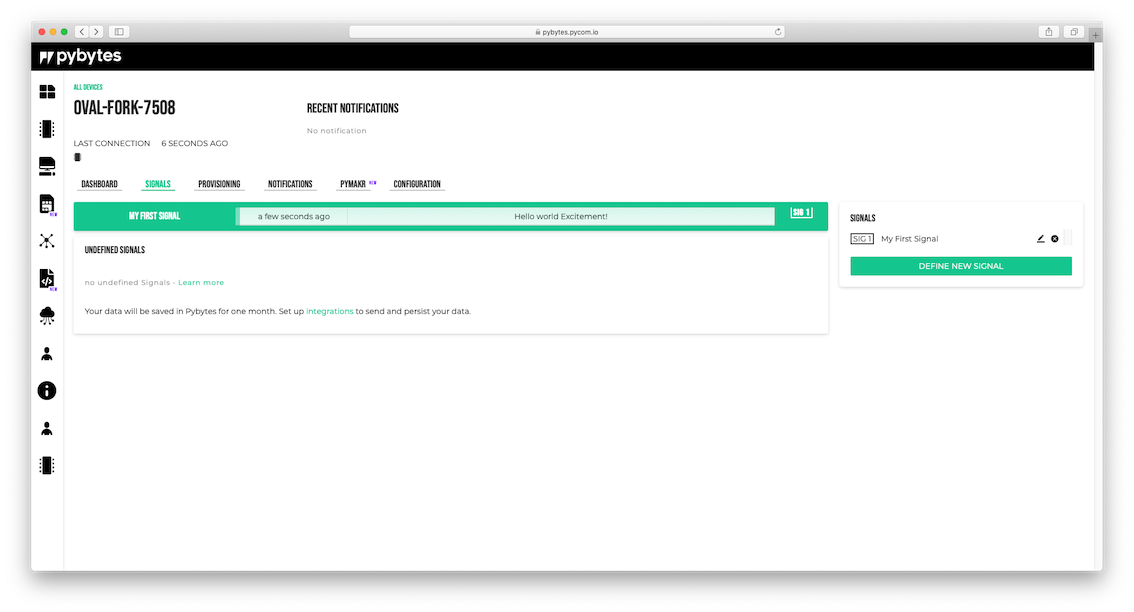
- Click on the signal card of the selected device.
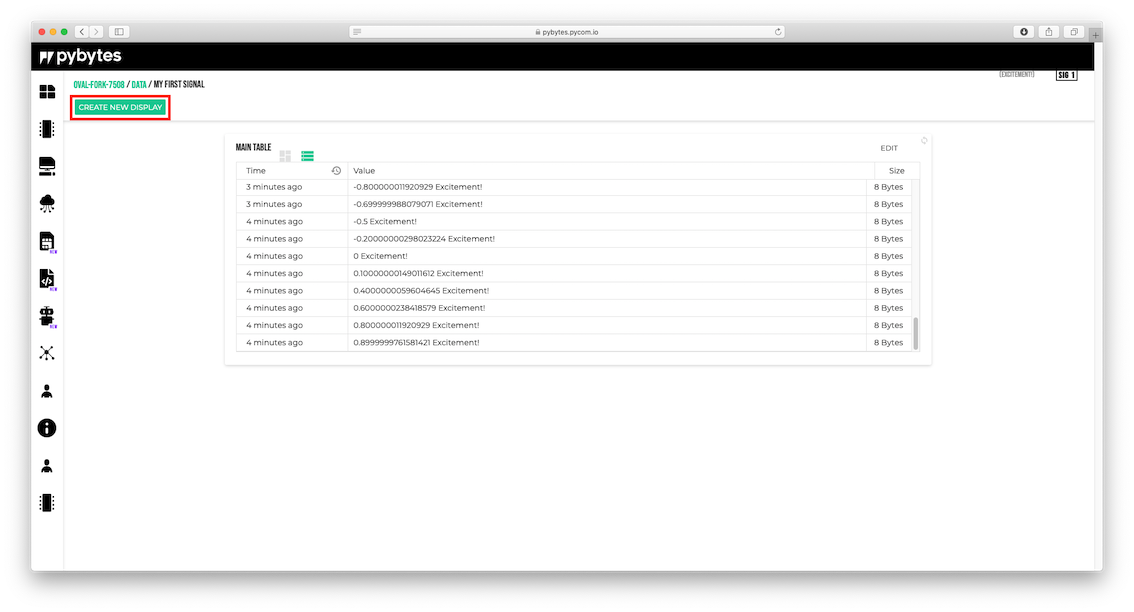
- Click on the Create a new display button.
-
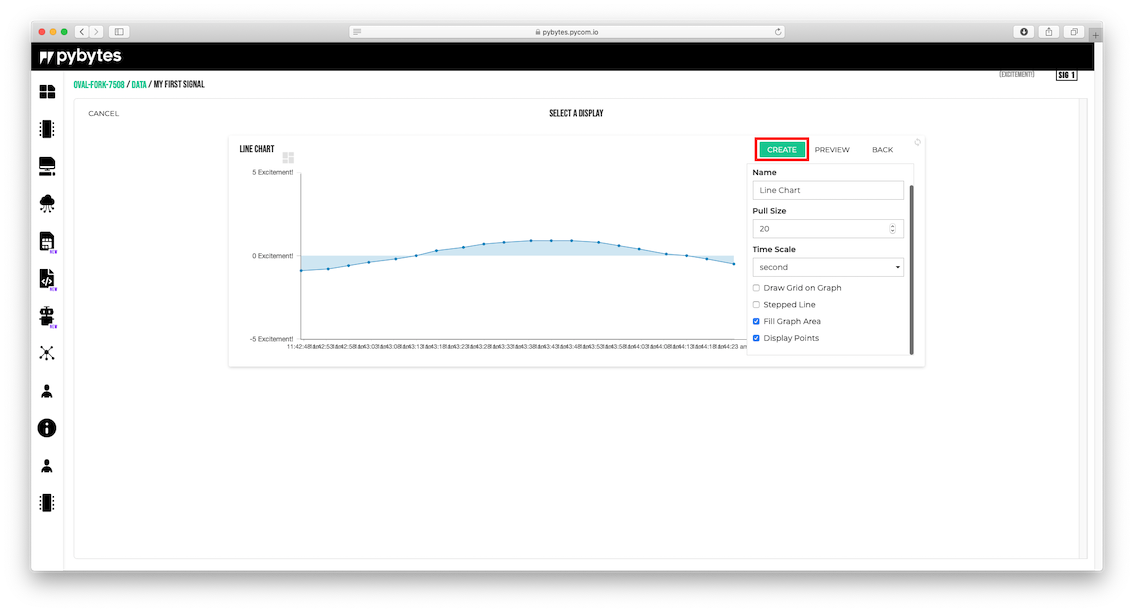
Select the type of visualisation (e.g. bar chart or line graph).
-
You can adjust the parameters of your widget at
Settings. After, click on the buttonCreate.
Your widget was created. Now, add your widget to your device’s dashboard. Click on the button Edit on your widget, and mark the checkbox Display on Dashboard at Settings. Finally, click on the button Save.
Click on the Dashboard tab. Your widget was successfully added there!
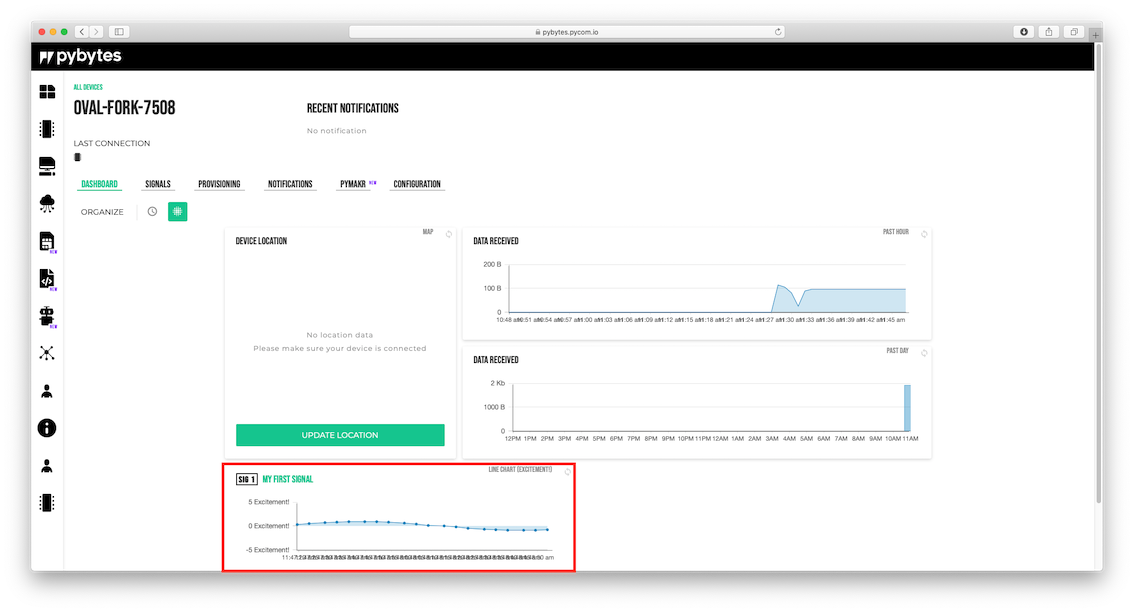
Done!
Now you’ve learned how to set up your device’s dashboard to display data. Also, you can add more widgets to your device’s other signals.